
Example calculation models
Panel types
Employee details
The Employee turnover panel shows employee turnover based on new employments and/or departures compared to the total number of employees.
Employment type External personnel are not included in this panel, only those with employment type Employee. You can filter by types of employment and positions.
There are four calculation models to choose from. For the first three, you choose to base the calculation on new employments or departures.
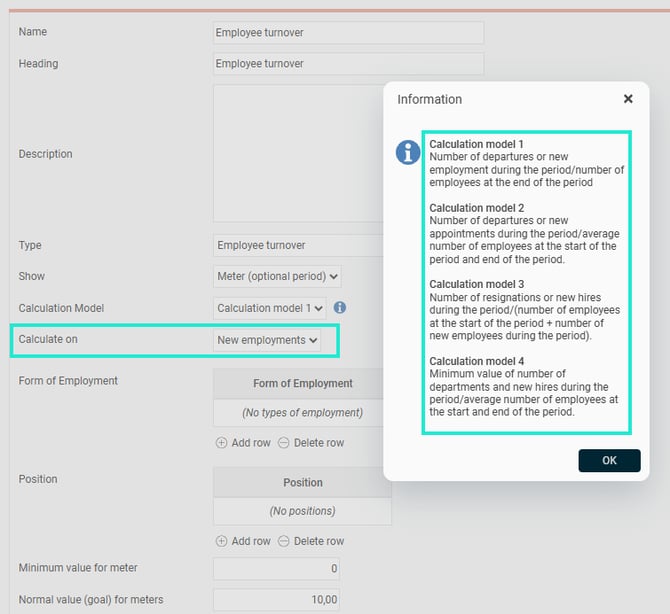
Calculation model 1:
Number of departures or new employments during the period / number of employees at the end of the period.
Calculation model 2:
Number of departures or new employments during the period / the average number of employees at the start and end of the period.
Calculation model 3:
Number of departures or new employments during the period / (number of employees at the start of the period + number of new employees during the period).
Calculation model 4:
The lowest value of number of departures and new employments during the period / the average number of employees at the start and end of the period.
Example calculation models
Below are examples of how the different calculation models work. In these examples, we assume a company with 100 employees.
Prerequisites:
The company has 100 employees today (June 2026).
A total of 120 employees have worked at the company.
Of these, 80 were employed before 2024.
20 employees were hired in January 2026.
20 employees were hired in March 2026.
In January 2026, 10 employees left.
In February 2026, 10 employees left
Calculation model 1
Number of departures or new employments during the period / number of employees at the end of the period.
Employee turnover = (Departures OR New employments during the period) / (Employees at the end of the period) × 100
|
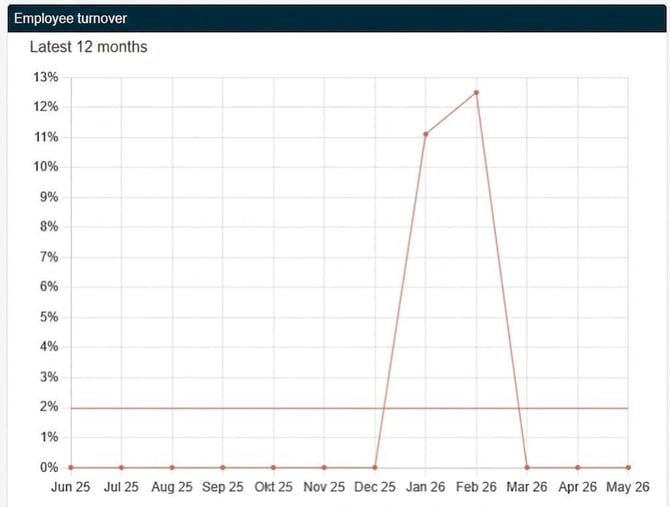
Based on Leavers: At the end of January, there were 90 employees. 10 leavers / 90 employees * 100 = 11.11% At the end of February, there were 80 employees. 10 leavers / 80 employees * 100 = 12.50% |
|
Calculation model 2
Number of departures or new employments during the period / the average number of employees at the start and end of the period.
Average = (Employees at start of period + Employees at end of period) / 2
Employee turnover = (Departures OR New employments) / Average × 100
|
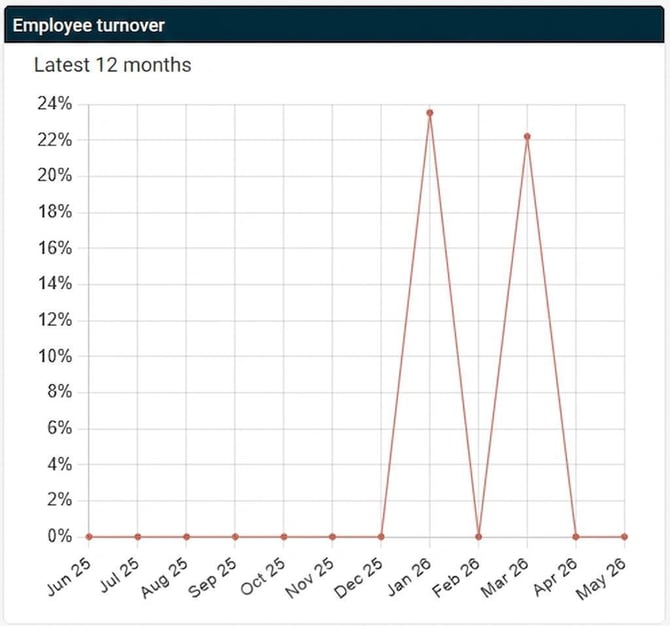
Based on New Hires: At the start of January, there were 80 employees; at the end of January, there were 90 employees. Average = (80 + 90) / 2 = 85 20 new hires during January gives 20 / 85 * 100 = 23.53% At the start of March, there were 80 employees; at the end of March, there were 100 employees. Average = (80 + 100) / 2 = 90 20 new hires during March gives 20 / 90 * 100 = 22.22% |
|
Calculation model 3
Number of departures or new employments during the period / (number of employees at the start of the period + number of new employees during the period).
Employee turnover = (Departures OR New employments) / (Employees at start + New employees during the period) × 100
|
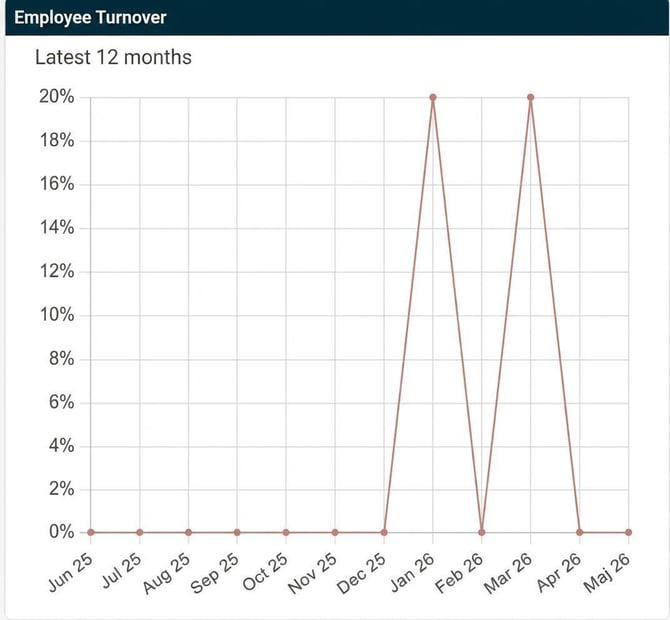
Based on New Hires: In January, 20 people were hired. At the start of January, there were 80 employees. 20 new hires / (80 + 20) * 100 = 20%
In March, 20 people were hired. At the start of March, there were 80 employees. 20 new hires / (80 + 20) * 100 = 20% |
|
Calculation model 4
The lowest value of number of departures and new employments during the period / the average number of employees at the start and end of the period.
Average = (Employees at start + Employees at end) / 2
Employee turnover = MIN(Departures, New employments) / Average × 100
|
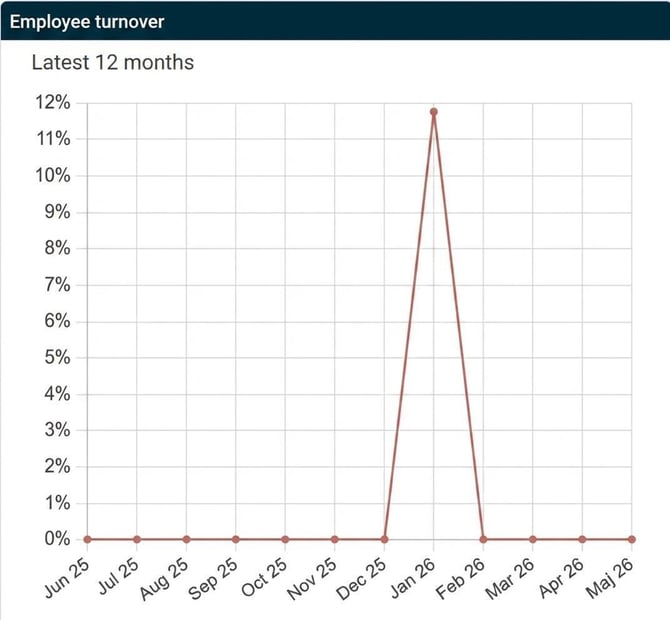
In January, 20 people were hired and 10 left. At the start of January, there were 80 employees; at the end of January, there were 90 employees. Average = (80 + 90) / 2 = 85. Employee turnover for January = 10 / 85 * 100 = 11.76% In March, when 20 employees also start, the employee turnover is 0 because the lowest value is 0 leavers. |
|
Panel types
The panel types graph and staple show a value per month or per year.
The panel types gauge/value (optional period) show a value which is the average for a selected period.
|
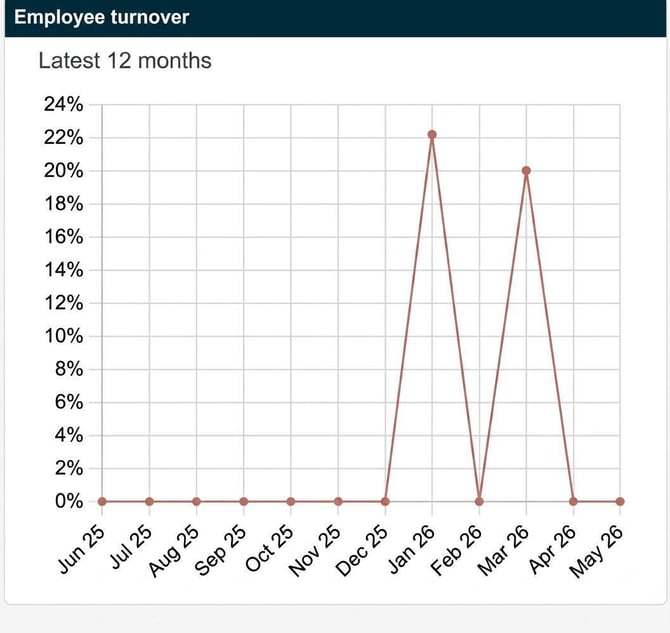
EXAMPLE: The chart shows the last 12 months; in January the value is 22.22%, and in March it is 20% |
|
| If we change the chart to a gauge and select the "Last 12 months" period, we instead get 3.52, which is the average value for all 12 months (42.22 / 12). | 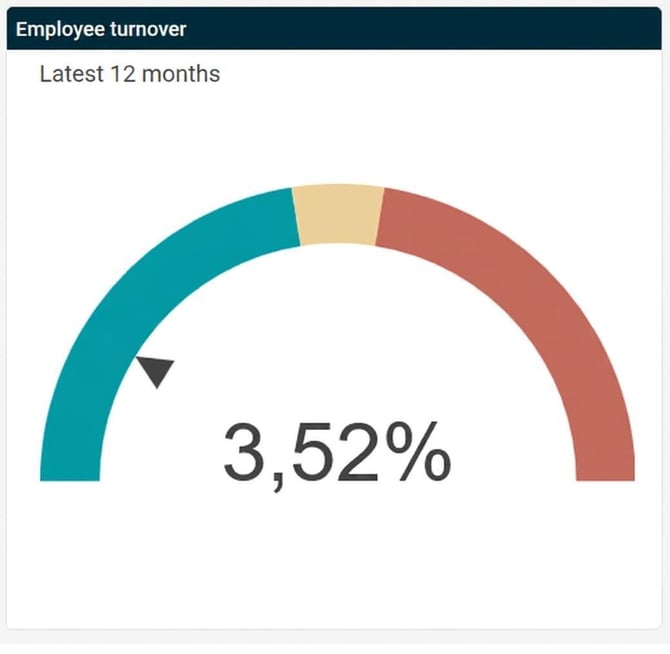
|
Employee details
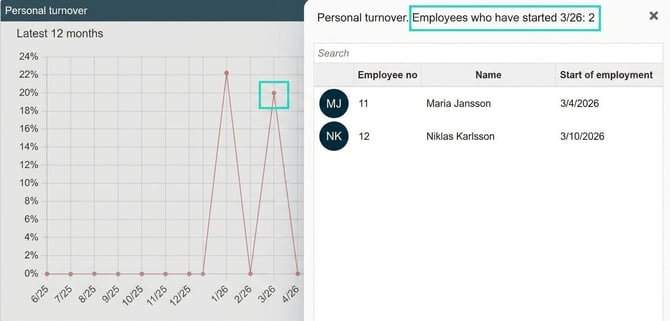
When you click on a full stop in the panel, you see which employees form the basis for the calculation in that particular period.
Who is displayed depends on the calculation model:
Model 1–3: Employees who have departed or been newly employed during the period, depending on the setting.
Model 4: Employees in the smaller group (departures vs new employments). If the numbers are equal, departures are displayed.
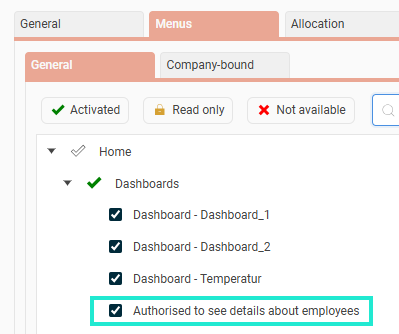
Who you see is also based on role permissions Authorised to see details about employees.
Please note: This article is AI-translated. This means that linguistic errors or misunderstandings may occur.