
Statistics types
Staffing - Follow-up
With the Staffing category, you can conveniently keep track of your budgeted values for hours, costs, and sales and compare them with scheduled time and actual outcomes. We have chosen to make it flexible. You decide which concepts you want to use, such as sales, number of cases or incoming orders. When viewing the results, you can choose whether you want to display a bar chart or a line chart and how you wish to group the values in the chart.
Time - Absence
If you select the Time - Absence category, you can make one or more selections should you wish to compare. Here is an example:
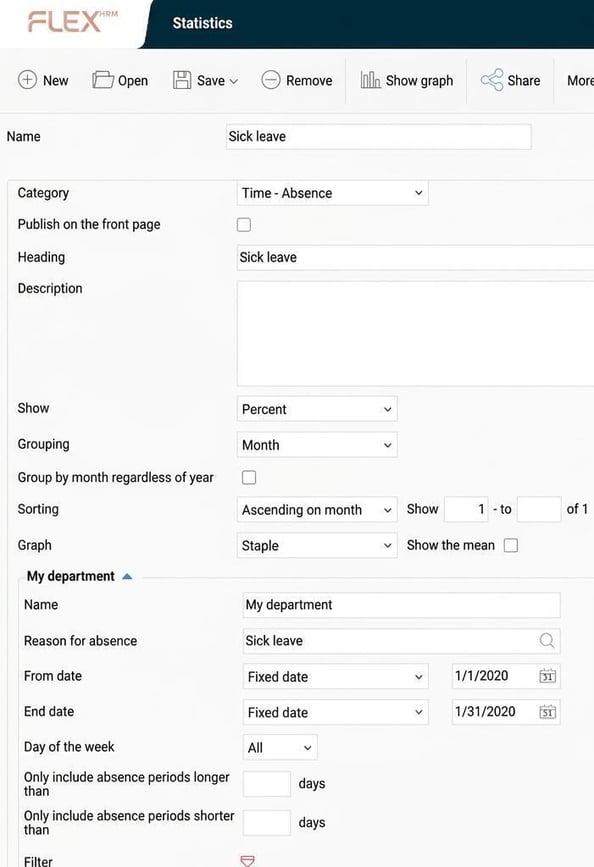
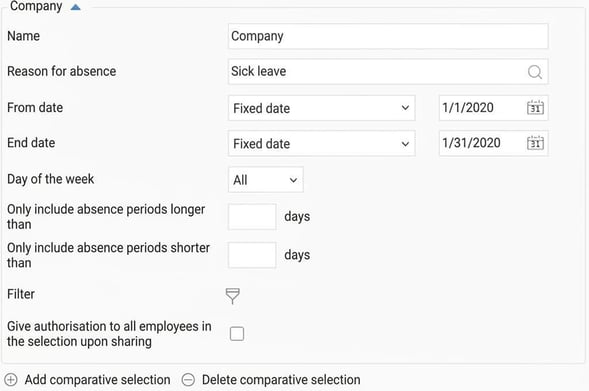
You want to see the sick leave percentage for a specific department, distributed per month throughout the year. You wish to compare this with the sick leave percentage for the entire company.
You then choose to display percentage (calculated as absence time divided by schedule time). You can also display number of hours of absence or number of absences. Then you choose to group per month and use a bar chart.
The first selection has a filter on employees, limiting it to only those belonging to the department you wish to view. The other selection has no filter and includes all employees in the company. To add more selections for comparison, click on Add comparative selection.
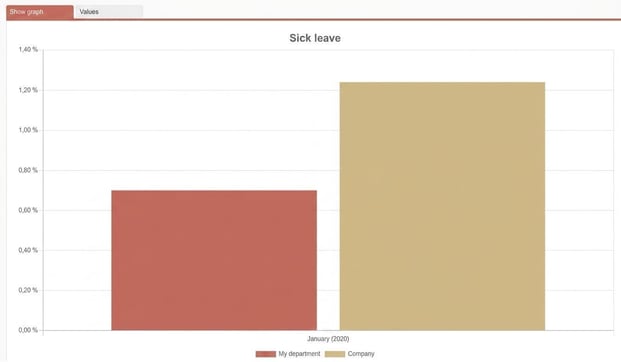
Then click on Show graph, and HRM will calculate the absence and display a graph on the right according to your selection.
There is also an option to save your statistics, so if you want to see what the absence looks like next month when another month has passed, you don't have to make all the selections again. To save a statistic, give it a name and then click on Save. There is also an option to Save as, which is useful if you want to start from a saved statistic, make some changes, and then save it as a new statistic while keeping the original.
Example - Grouping
All statistics can be grouped by registered account codes and by home account codes. You will find these options under Grouping in the display settings for your statistic.
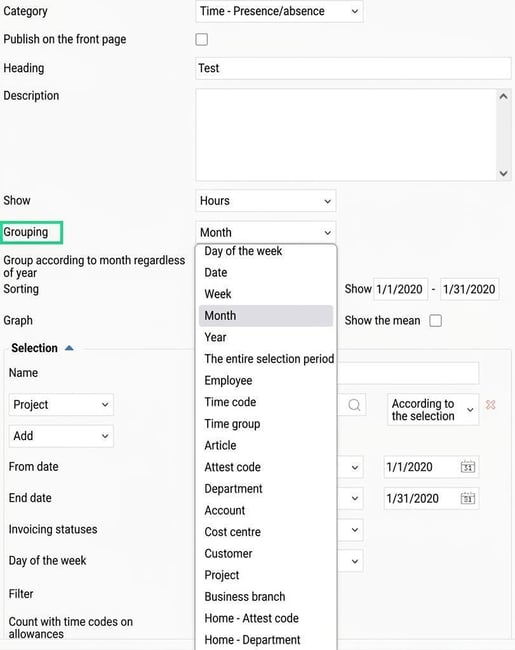
Under Grouping, you can choose how the grouping is to be applied for recurring grouping options.
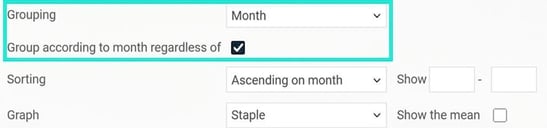
If you select to group statistics per month or per week, you can choose whether to group per month or week regardless of year. This means that if you extract statistics covering multiple years, they will be grouped per month or week so that the same month or week in each year is grouped together.
If you choose to group by date, you can now group by date regardless of month and year.
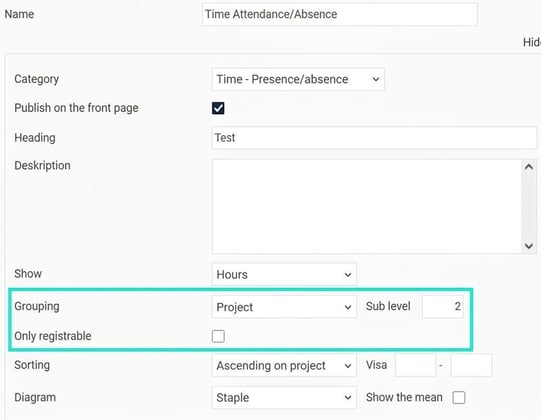
If you use an extended project register and choose to group by project, you can now select which sub level you want to group by. By grouping at any sub level, you can divide up the grouping based on your preferences.
For extended projects, you can also choose to display only registrable projects.
Sorting
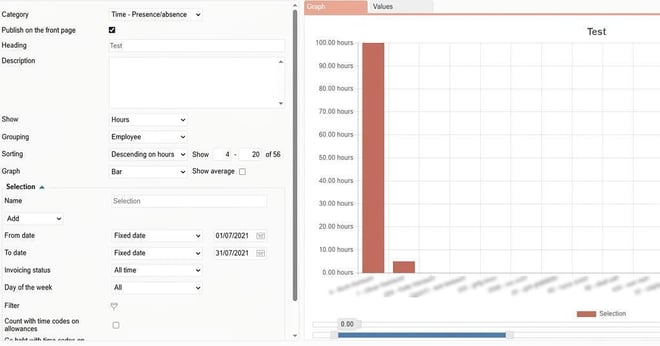
Sorting can be performed either on the unit selected under display or on the grouping option. Sorting can be ascending or descending. For example, if you select to analyze statistics for attendance and choose to display percentage of scheduled time and group per month, you will get the following four sorting options: ascending by month, descending by month, ascending by hours, and descending by hours.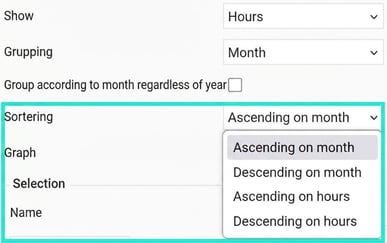
Within sorting, you can also select which results you want to display. This is useful if you receive many results. For example, if you want to display attendance hours per employee, you can sort descending by hours and then choose to show 1–10 to see the ten employees with the highest attendance hours. Here you can also see the total number of results.
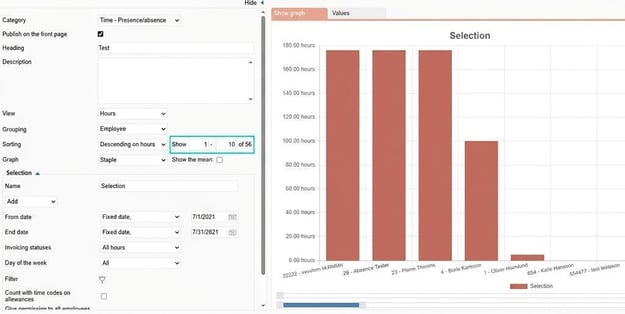
If you wish, you can adjust the display beneath the graph, where the lower slider controls which interval you want to display and the upper slider shifts the interval.
Long- and short-term absence
There is an option to filter out certain absence in reports and statistics based on the length of the absence. This is primarily intended to allow you to filter out long-term absence in sickness absence statistics. Otherwise, a long-term sick leave for one employee could significantly increase the sick leave percentage in a department when you are actually interested in tracking trends for "regular" shorter absence. This also enables you to track only long-term sick leave and observe trends related to these in your company.
You will find this filtering based on absence length at the following locations in Flex HRM:
- The Absence statistics report
- Absence in the Statistics Centre
- Exports via the export template 'Absence'
- Dashboard
At these locations, we have added options for Include only absence periods longer than... days and Include only absence periods shorter than ... days. 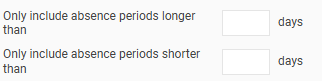
By default, these options are empty, which means all absence in the selection is included, just as before.
If you configure it to include only absence periods longer than 14 days, only absence periods longer than 14 days will be included. For an absence period of, for example, 30 days, all 30 days will be counted.

If you select the setting Do not include the first 14 days on the right, an absence period of 30 days will not count the first 14 days, only the last 16 days.

If you choose to include only absence periods shorter than 15 days only those will be included.

The last option, with the setting Include longer absence, but only the first 14 days selected, will also include longer absence periods, but only the first 14 days of those periods.
You can also combine these two settings, for instance, to include only absence longer than 14 days but shorter than 91 days, which you may wish to track.
As Sweden has special regulations regarding what counts as a contiguous period of illness when relapsing, we consider this if the company's home country is Sweden and if you are filtering by reason for absence of type sickness. This means if an employee falls ill again within 5 days, it is considered the same continuous period, but the days worked by the employee are not counted as sick days.
Note that export of absence exports individual absence records, so only each record is checked against any filtering set for length of absence. In other words, each absence record is exported in full or not at all.
Time – Attendance / Absence
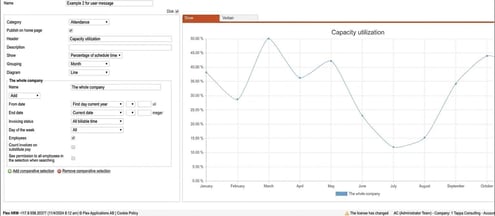
With the Attendance/Absence category, you can extract statistics to monitor overtime, capacity utilization, invoice amount or time spent on different projects, again with the possibility of comparisons between different departments and/or time intervals.
Under Show you choose whether to extract the number of reported hours, part of reported time in relation to scheduled time, or part of reported time of total presence time.
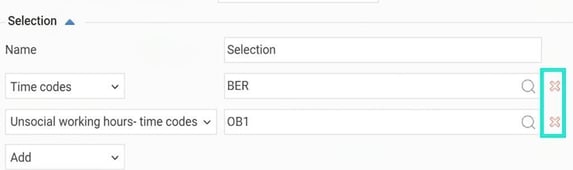
Selection by time codes and account codes is added by choosing the desired option in the selection list under Add. If you select a time code and/or account code, only time reported on those will be included. If no selection is made, all time codes/account codes will be included. To remove a selection you have added, click the red cross next to the selection.
You can also filter by invoicing status:
| All time | All time regardless of invoicing status will be included. |
| All billable time | All time marked for invoicing will be included regardless of whether it has been released for invoicing or not. |
| Only accumulated time | Only time marked for invoicing that has not been released for invoicing will be included, i.e., work in progress that has not yet been invoiced. |
| Only billed time | Only time marked for invoicing and released for invoicing will be included. |
If you tick the checkbox Include time codes on the Allowance tab this will also include presence time codes reported on the tab Allowances in the time report.
Below are two examples of how settings and selections can be made.
The first example shows what it may look like if you want to see how much overtime has been worked in different departments, grouped per month.
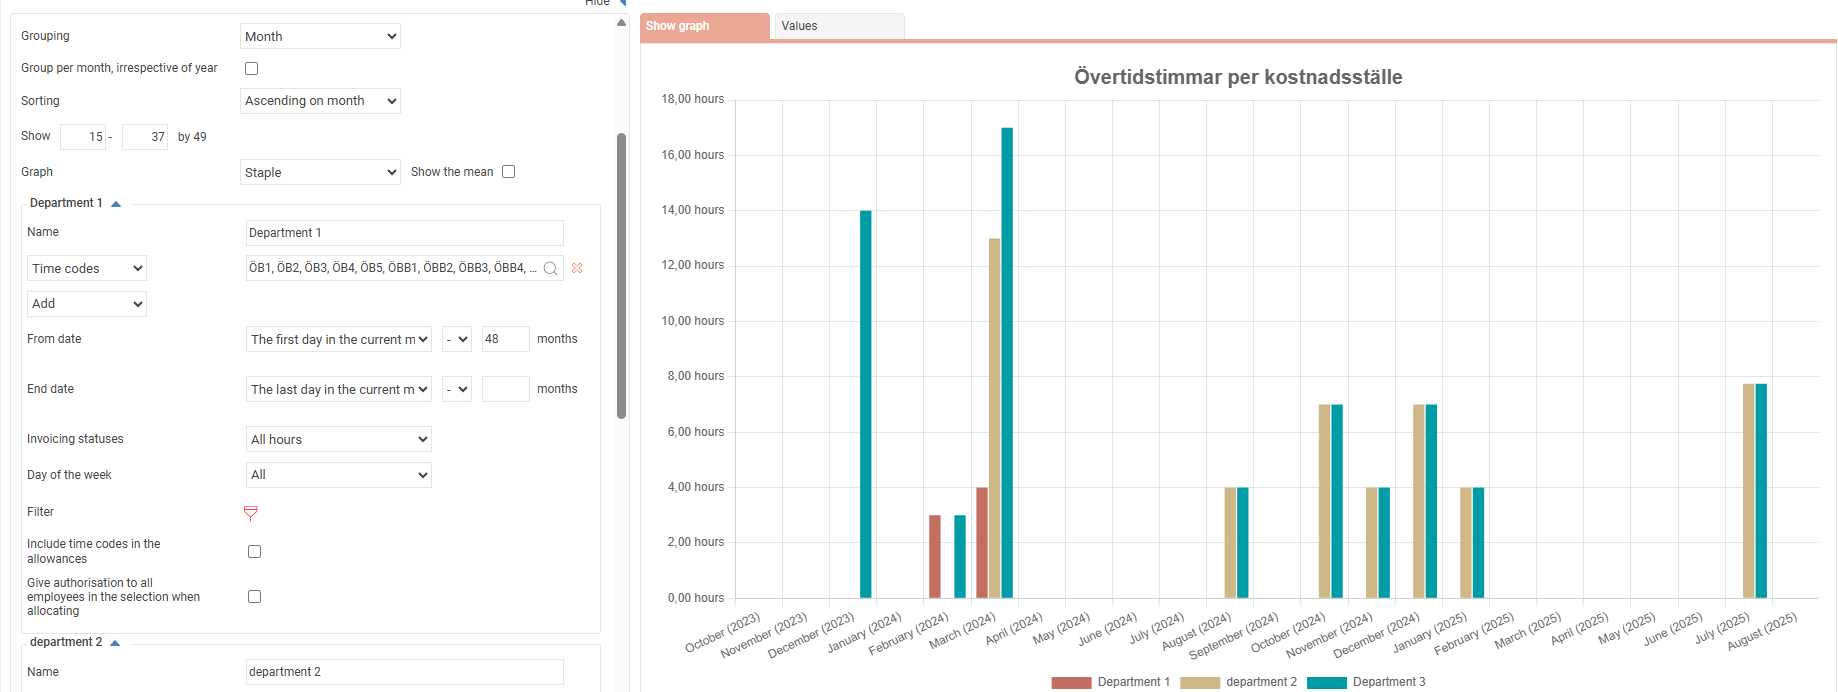
The second example shows what it may look like if you want to see how the capacity utilization in the company has changed over the year.
Travel expense claim – Travel costs
When you choose to extract statistics on travel costs, the Statistics Centre will be able to include all types of costs on the travel expense claim. The statistics can be grouped by day of the week, date, week, month, year, the entire selection period, cost type, employee, account code, and home account codes that have marked Authorisation and selection.
You can add selection on expenses, increments, mileage claim, subsistence allowance, countries and account codes.
Selections by date can be made on From date, To date, and Payment date. For example, if you filter by From date 20XX-01-01 to 20XX-01-31, you will include all journeys commencing in January 20XX.
You can filter by day of the week, invoicing status, and whether the selection should display amount or invoice amount. Selections can be made for taxable, tax-free and how VAT is to be calculated in the statistics.
Finally, you can filter which employees’ costs will be included in the statistics.
Travel expense claim – Expenses
Statistics for expenses are similar to those for all travel costs, but for expenses there is also the option to group by expense code and the selections you can add are limited to filtering by expense code and account codes.
Travel expense claim – Subsistence allowance
Subsistence allowance statistics are also similar to those for all travel costs, but there is also the option to group per country.
HR – Employees
An efficient handling of statistics concerning employees is a central part in the management of an organisation. It may be about measuring the number of employees per department, number of full time positions (FTP), change in number of employees over time, percentage distribution between men and women, as well as various key performance indicators to measure employee turnover. To meet these requirements, we have expanded the support in the Statistics Centre (add-on module) to enable this type of statistics.
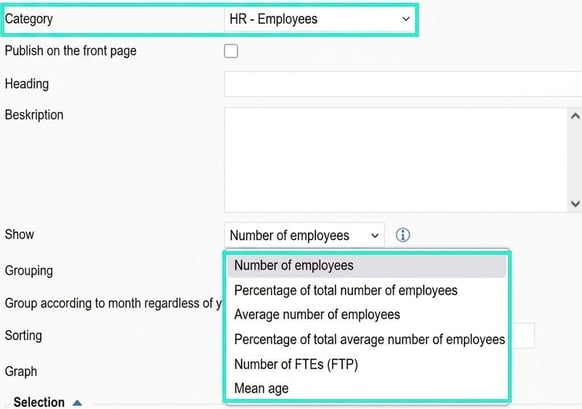
Number of employees
Shows the number of employees who have been employed at least one day during the date interval.
Percentage of total number of employees
Shows the percentage of total number of employees during the interval. Best applied when you specify a selection in the filter or group by, for example, department, age, or gender.
Average number of employees
Shows the average number of employees during the interval/grouping.
Calculation: (sum of number of employees per day)/(number of days).
Percentage of average total number of employees
Shows the percentage of average total number of employees. Best applied when you specify a selection in the filter or group by, for example, department, age, or gender.
Number of full time positions (FTP
Shows the number of positions converted to full time positions during the interval, which internationally is called FTE (Full-Time Equivalent).
Calculation (per day): (sum of the employees' contractual working hours)/(number of employees).
Example: Over a period of 30 days, an employee had contractual working hours of 100% for 15 days and 50% for 15 days. The employee is counted as 75% of a full time position for that period.
Mean age
Shows the mean age for the interval/grouping. The age of each employee is calculated on the last date within the interval/grouping.
HR – Employee turnover
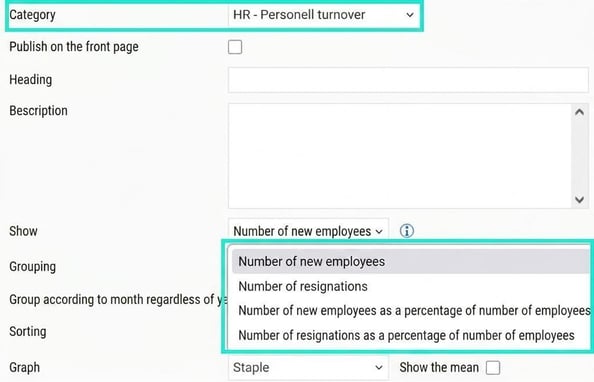
Number of new employees
Shows the number of new employees during the interval/grouping. An employee is counted as new if they have an employment period within the interval/grouping that is either their first employment period or where the previous employment period is not directly adjoining.
Number of resignations
Shows the number of resignations during the interval/grouping. An employee is counted as resigned if they have an employment period within the interval/grouping that is either their last employment period or where the following employment period is not directly adjoining.
Number of new employees as a percentage of employees
Shows the number of new employees as a percentage of the total number of employees during the interval/grouping.
Number of resignations as a percentage of employees
Shows the number of resignations as a percentage of total number of employees during the interval/grouping.
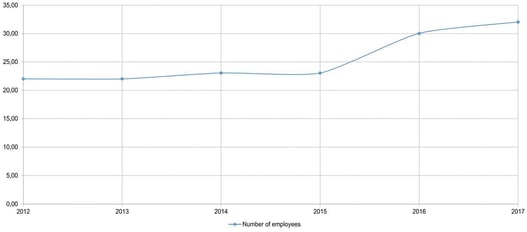
You can group these statistics to easily get interesting statistics. The following can be grouped by: Week, Month, Quarter, Year. Grouping by various time intervals can be useful when you want to see, for example, how the number of employees has changed over time.
Example: Number of employees per year for the last five years.
Position, Time group, Personnel category, Form of Employment
Number of employees or number of positions per group can be interesting statistics to keep track of. The statistics are based, for example, on the last position the employee had in the selection period.
Example: Number of full time positions per position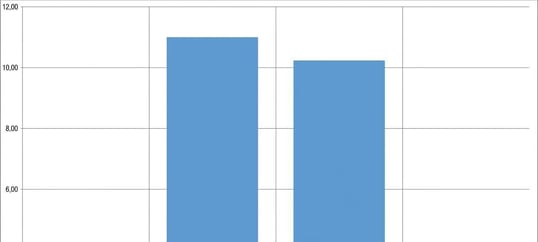
Gender and age
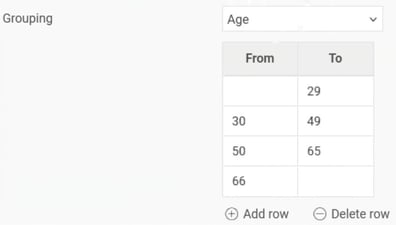
Distribution between gender and age are interesting factors to achieve a suitable mix in a work team. When grouping by age, you can choose which age groups you wish to use.
Example: Number of employees per age group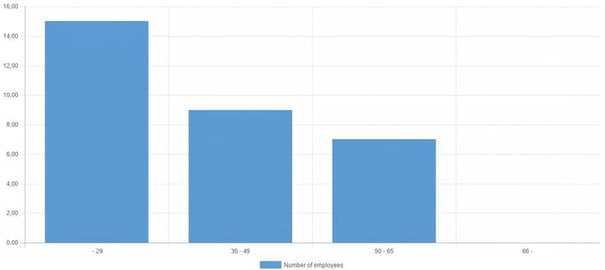
Home account code
Grouping by, for example, department, cost centre or other dimensions used in your company can be made via home account code.
Example: Number of employees per cost centre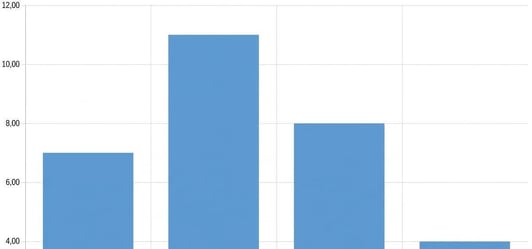
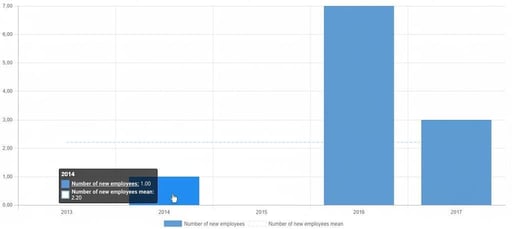
You can also choose to display a line for mean value in a statistic so that you can easily see the average. Enable this by ticking Show the mean next to the option for chart type.
Example: Number of new employees per year for the last few years, including the mean.
Related articles:

Statistics- What is the Statistics?

Statistics on the front page - How do I configure and view statistics on the front page?
Please note: This article is AI-translated. This means that linguistic errors or misunderstandings may occur.