
General
The concept of the Statistics is that it should serve as a complement to the existing reports and exports that can be generated, as well as provide the possibility to analyse, compare and interpret different types of values and easily produce relevant statistics for follow-up. These functions require the customer to have the additional module. Statistics in the licences.
Created statistics can be shared with other users. Statistics can be managed via roles/users. Comparative selections can be made between, for example, departments, gender, age, etc.
Important to keep in mind regarding different types of statistics:
Attendance statistics
- also includes preliminary attendance from time reports
- can, if needed, fetch time codes from the Allowance tab
- CANNOT include Allowances from the Allowance tab
- can take reported account codes into consideration
Absence statistics
- also include preliminary absence from time reports (not requests)
HR/Employee statistics
- employees must be finally reviewed to be counted as employees
- FTE statistics Number of FTEs shows within the interval/grouping, the sum of the employees' contractual working hours per day. Is being calculated (per day): (sum of employees' contractual working hours)/(number of employees). Example: during a period, an employee has a contractual working hour of 100% for 5 days and 50% for 5 days. The employee is thus counted as 0.75 of a full-time employment during that period.
- FTE statistics does not consider absence (only FTE via Dashboard, which is controlled by time code settings for FTE)
Authorisation
Authorisation for the Statistics is set in Administration > Users/Authorities > Roles. There you can decide which roles should have access to the Statistics, if they can share statistics, and if they can see all employees regardless of other authorities. For example, you can enable managers to compare their department’s absence with the entire company. If the setting Authorised to all employees is not ticked, only absence for employees you are authorised to in the time report will be generated (including read-only authorisations). The same applies to staffing; only employees and account codes the user is authorised to determine staffing for will be included.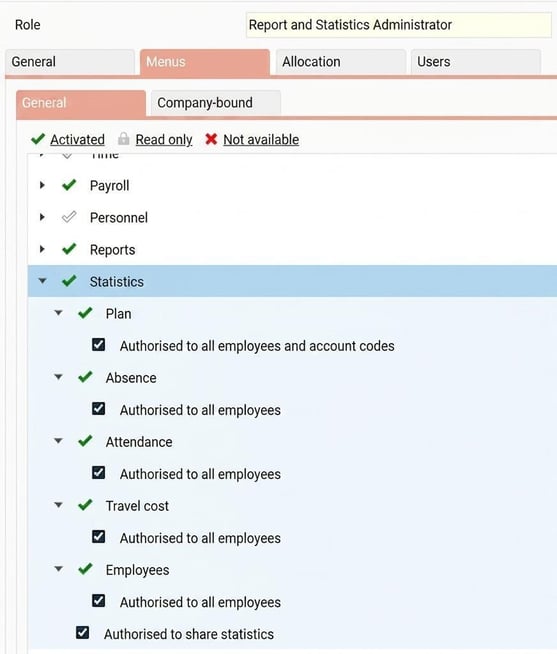
Please note! The user who has created and shared something via the Statistics is the only one who can open and revise the created model. This means that if the user in question is no longer active, the user needs to be reactivated and logged in to revise.
Work with the Statistics
The Statistics has its own main icon below the Reports icon.
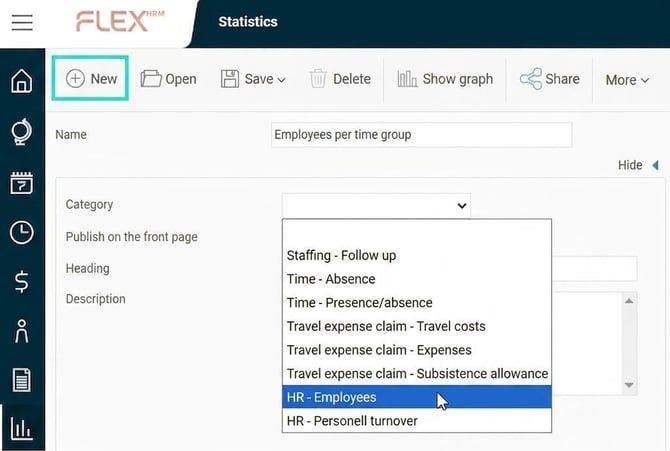
The user is brought to a view where they can choose to retrieve a saved statistic or create a new one. When you create a new statistic, click on the icon New. Select then category, i.e. what type of statistic you want to produce, for example HR - Employees.
Show graph
You can click Show graph after specifying your selections; the statistic is generated and a graph appears on the right side of the screen.
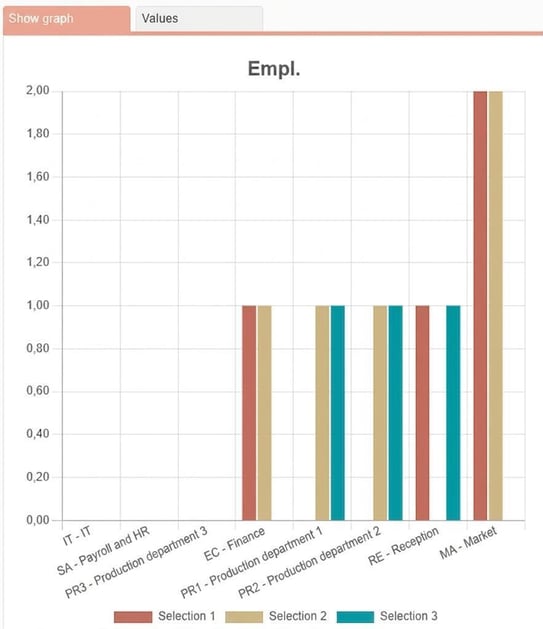
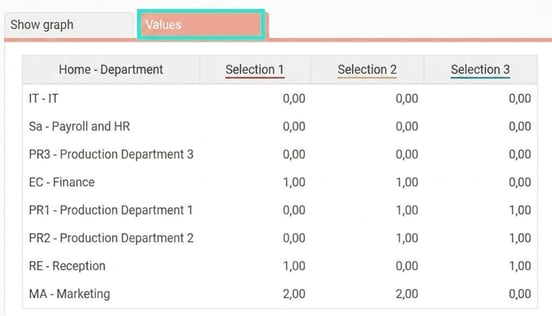
If you instead want to view the statistic as values, click on the tab Values.
Authorisation - Share
If you click on Share you can choose to share a statistic with other users. A window then appears where you select various types, e.g. roles, account codes, and users, with whom you wish to share the statistic.
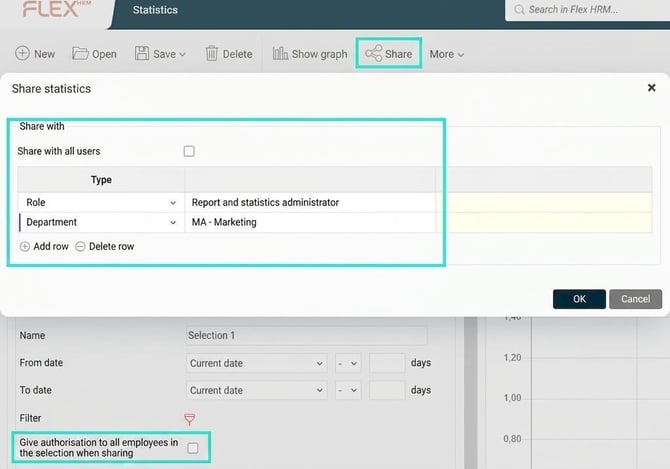
If the setting Give authorisation to all employees and projects in the selection when sharing is ticked for a selection when sharing a statistic, the recipient will be able to see, for example, absence for all employees in that selection regardless of their authorisation. This can be useful if you wish to share a statistic with managers who are not authorised for all employees but still want to compare their department’s absence with the total for the entire company.
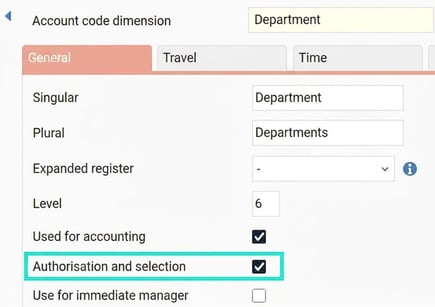
The account codes you share to are the employees’ home account codes and those account code dimensions that have the setting Authorisation and selection (Settings > General > Account code dimensions) ticked.
More menu - Settings
Click on Settings under the More menu More to process your selections. Here, you can move selections you have made by dragging and dropping the blue arrows. You can also delete selections by clicking on the red cross.
More menu - Export
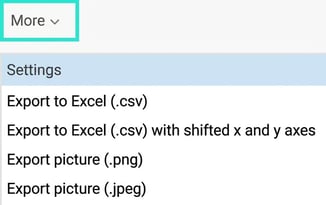
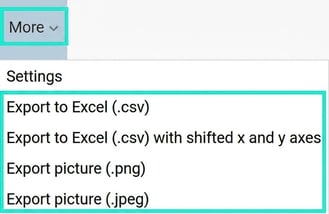
Under the menu More you can export data and graph from the Statistics. Data is exported in CSV format, which can be opened in e.g. Excel, and the graph as an image in PNG or JPEG format.
If you export to CSV format, you can choose whether the data should be exported exactly as it appears under the Values tab Values or if you wish to swap the x and y axes.
When you export the graph as an image, the PNG image will have a transparent background, while the JPEG image will have a white background.
Related articles:

Types of statistics - What do the different types of statistics in the Statistics mean?

Statistics on the front page - How do I configure and view statistics on the front page?
Please note: This article is AI-translated. This means that linguistic errors or misunderstandings may occur.