
Dashboard in Flex HRM
As an Administrator, you can create several dashboards tailored for different purposes and roles within the company. You control who can see what, so that management, HR, and managers always have access to relevant and up-to-date information.
Which key performance indicators you can display on a dashboard depends on the modules of Flex HRM included in your licence.
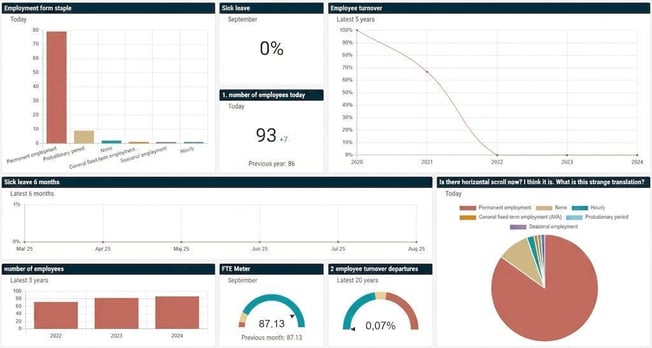
How dashboards and panels work
A dashboard serves as a collection point where you present information. The actual information, such as a pie chart showing sick leave or a gauge for employee turnover, is placed in so-called panels.
You first create the panels you wish to use and then add them to a dashboard. You can reuse the same panel in several different dashboards.
Create and configure a dashboard
Here we describe how you as an Administrator set up a completely new dashboard.
Step 1: Create panels
Start by creating the panels that will display data in your dashboard.
-
Go to Administration > System register > Dashboard > Panels. You will then see a list of existing panels.
-
Click on New to create a new panel.
-
Fill in the fields:
-
Name: An internal name for the panel.
-
Heading: The heading that will be visible on the panel in the dashboard. If you leave the field empty, the name will be used.
-
Description: An optional internal description.
-
-
Under Type select which kind of data the panel should retrieve.
-
Under Display select how the data should be presented, for example, as a line graph, a gauge, or a basic value.
-
Depending on your options, you may need to make further settings for the panel.
You can create several panels of the same type. For example, you can have one panel showing the number of employees today as a value, and another showing the historical trend in a line graph.
In the article "Panels in Dashboard - How do the shared settings work?" you can read more about the various settings.
Step 2: Create a dashboard and add panels
Once you have created your panels, it is time to create the actual dashboard.
-
Go to Administration > System register > Dashboard > Dashboards.
-
Mark a panel in the list on the right and click the Add panel button to add it to your dashboard.
-
You can move panels around and change their size by dragging them, so you get the layout you want.
Step 3: Set authorisation for roles
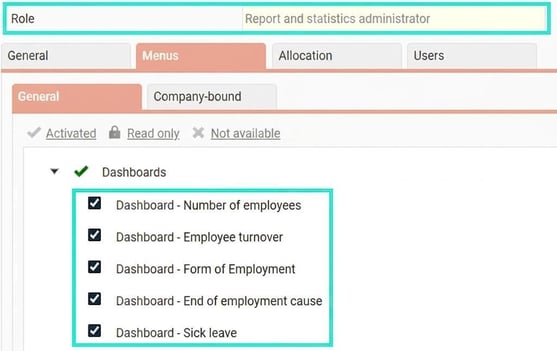
For users to be able to see the new dashboard, you need to give their roles authorisation to it.
-
Go to Administration > Users /Authorisations > Roles.
-
Select the role that should have access to the dashboard.
-
Under the node Home you will see a list of available dashboards. Tick the dashboard or dashboards that the role should be authorised to.
Authorisation control in dashboards
You can control which data a user sees in a dashboard based on their role. This is useful if, for example, you want a department manager to see only the key performance indicators for their own department.
-
Select the dashboard you want to set authorisations for.
-
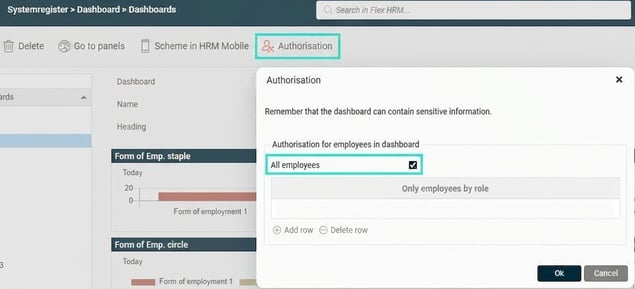
Click on the icon for Authorisation.
-
A dialogue box will appear:
-
If you tick the box All employees no authorisation control is applied, and everyone who sees the dashboard will see data for all employees.
-
-
-
If the box not is unticked, the user will only see data for the employees matching their role.
-
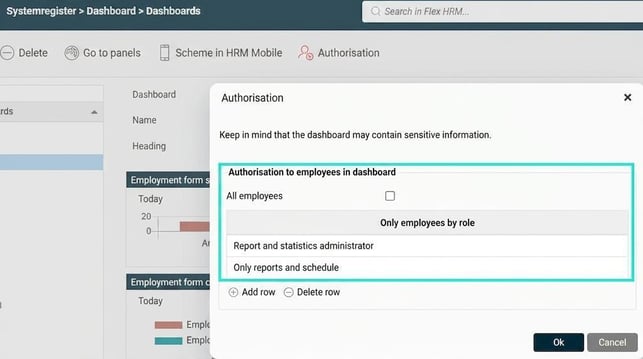
Note! If a dashboard does not have a linked role and the box "All employees" not is unticked, the graphs will not display any data.
More settings
View employee details
In the authorisation settings for a role (Administration > Users /Authorisations > Roles) there is an option Authorised to view employee details. If you tick this box, the user can click on a part of a graph, for example, a staple, to see a list of the employees the data is based on.
Customise for HRM Mobile
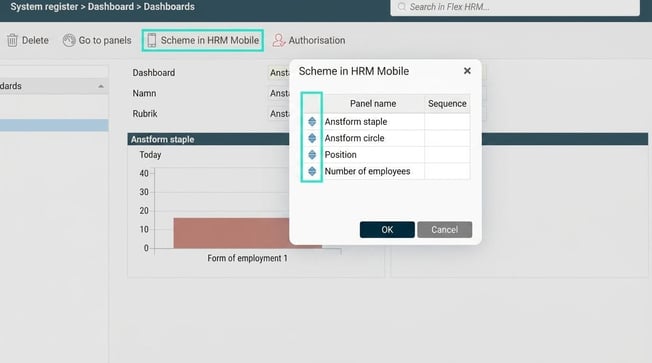
You can determine the sequence in which panels are displayed in the HRM Mobile app. In the view where you configure your dashboard, drag and drop the panels using the blue arrows to change the sequence.
Related articles:

How do I present Dashboards on the Front page (Home)?

Panels in Dashboard - How do the shared settings for panels in Dashboard work?

Dashboard - Gauge/Value - How do I measure and visualise my values?
Please note: This article is AI-translated. This means that linguistic errors or misunderstandings may occur.